Every year, hundreds of lives are shattered on Las Vegas roads because of drunk driving. Between 2018 and 2023, there were 11,524 DUI-related crashes across Las Vegas, North Las Vegas, and Henderson, resulting in 9,095 injuries and 222 deaths. We analyzed five years of crash data from the Nevada Department of Transportation to uncover the most dangerous roads, intersections, times of day, and even holidays for alcohol-related crashes in the Las Vegas area. Here’s what the data shows.
Year to Year Las Vegas DUI Crashes
From April 2018 to November 2023, DUI crashes in the Las Vegas metro fluctuated sharply, dipping in 2020 during pandemic shutdowns, then spiking again in 2021–2022 as nightlife and tourism returned. The chart below highlights how crash totals have shifted year by year. 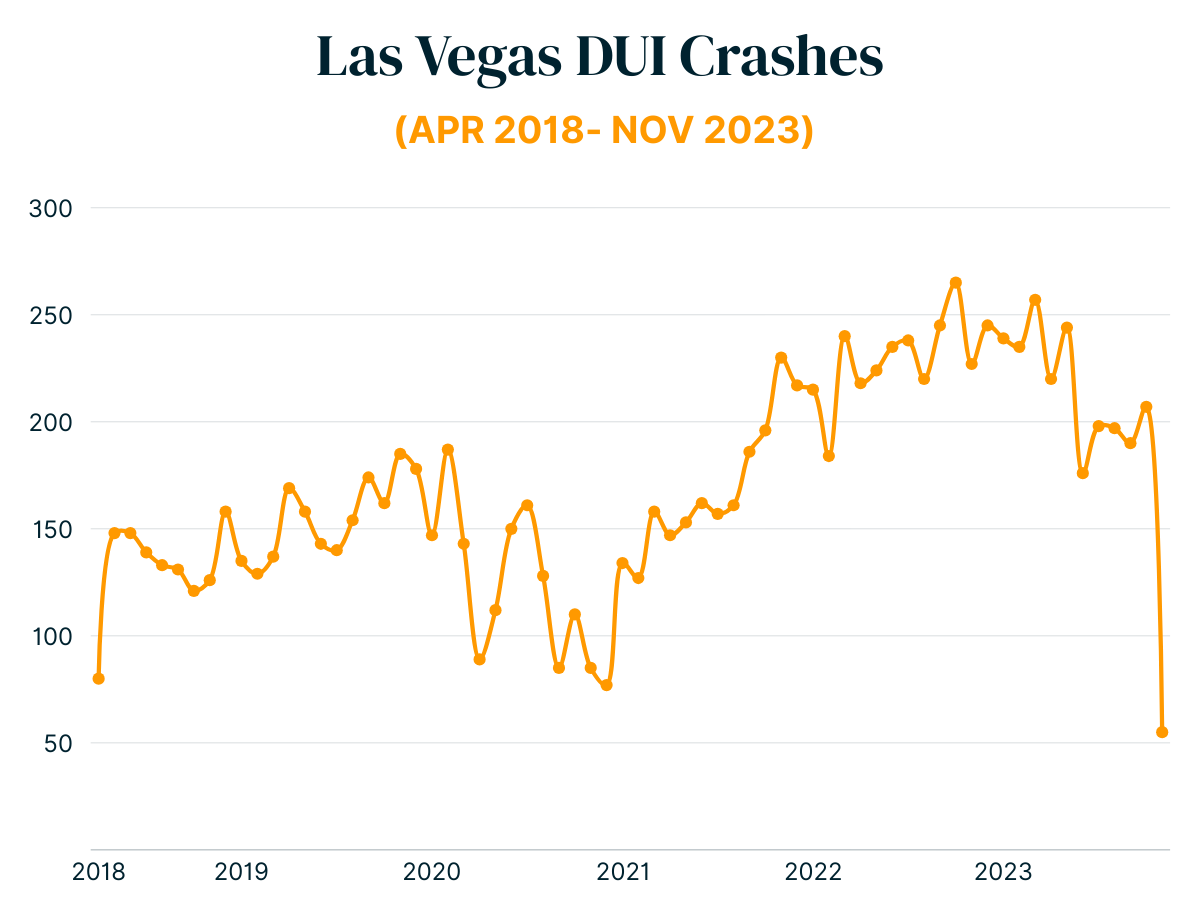
Key Storyline:
- 2018–2019 (High Baseline): DUI crashes averaged 1,500–1,800 per year.
- 2020 (Pandemic Low): DUI crashes dropped by 21% compared to 2019, alongside a sharp decline in injuries, as lockdowns and travel restrictions kept fewer cars on the road.
- 2021–2022 (Rebound & Peak): Crashes surged back with the return of nightlife and tourism. 2022 was the most dangerous year, recording a peak of 2,756 crashes.
- 2023 (Partial Decline): Numbers dipped slightly but still remained higher than pre-pandemic lows, with over 2,200 crashes.
The Most Dangerous Roads for DUI Crashes in Las Vegas
Some Las Vegas roads consistently see more DUI-related crashes, injuries, and fatalities than others, especially busy roads with high traffic flow, nightlife, and commercial zones. Here are the top 10 roads for DUI crashes in Las Vegas:
| Road | Total Crash | Total Injuries | Total Fatalities |
|---|---|---|---|
| S LAS VEGAS BLVD | 425 | 313 | 6 |
| E FLAMINGO RD | 214 | 199 | 6 |
| W SAHARA AVE | 182 | 178 | 5 |
| W FLAMINGO RD | 172 | 150 | 6 |
| E SAHARA AVE | 169 | 168 | 8 |
| E CHARLESTON BLVD | 167 | 147 | 6 |
| S DECATUR BLVD | 163 | 175 | 7 |
| S EASTERN AVE | 148 | 138 | 5 |
| E TROPICANA AVE | 147 | 170 | 2 |
| W TROPICANA AVE | 147 | 117 | 3 |
Key Insights:
- #1 Hotspot: S Las Vegas Blvd (“The Strip”) leads all roads with 425 DUI crashes and 313 injuries.
- Deadliest Road: E Sahara Ave had the most fatalities (8), despite fewer total crashes.
- High-Risk Corridors: Flamingo Rd, Sahara Ave, Charleston Blvd, and Decatur Blvd all appear multiple times, showing systemic risk on major arterials.
- Injury-Rich Crashes: Roads like E Flamingo Rd and W Sahara Ave have injury counts nearly matching crash totals – meaning almost every crash results in injury.
The Most Dangerous Intersections for DUI Crashes
While Vegas roads pose broad risks, certain intersections are persistent hotspots for DUI crashes, especially in dense or high-speed zones.
| Intersection | Total Crash | Total Injuries | Total Fatalities |
|---|---|---|---|
| E Lake Mead Blvd & N Lamb Blvd | 6 | 8 | 0 |
| E Lake Mead Blvd & N Walnut Rd | 6 | 6 | 0 |
| N Stephanie St & Stufflebeam Ave | 6 | 2 | 0 |
| Stewart Ave & N 4th St | 6 | 2 | 0 |
| S Decatur Blvd & W Oakey Blvd | 5 | 17 | 1 |
| W Sahara Ave & S Rainbow Blvd | 5 | 9 | 2 |
| E Lake Mead Blvd & Mt Hood St | 5 | 8 | 1 |
| S Jones Blvd & W Robindale Rd | 5 | 9 | 0 |
| W Flamingo Rd & Granite Ridge Dr | 5 | 4 | 1 |
Key Insights:
- Concentrated Clusters: Four intersections had 6 crashes each – several along E Lake Mead Blvd.
- High Injury Zone: S Decatur Blvd & W Oakey Blvd had 17 injuries from just 5 crashes – highest injury-per-crash ratio.
- Fatal Hotspots: W Sahara Ave & S Rainbow Blvd had 2 deaths, the most among all intersections.
- Lake Mead Trouble: Three of the top intersections are on E Lake Mead Blvd – pointing to a dangerous corridor
When DUI Crashes Are Most Likely to Happen in Las Vegas
DUI crash risk in the Las Vegas area spikes at night, with the highest danger between 8:00 PM and 3:00 AM. Data from Henderson, Las Vegas, and North Las Vegas shows a clear link between nightlife hours and impaired driving incidents. 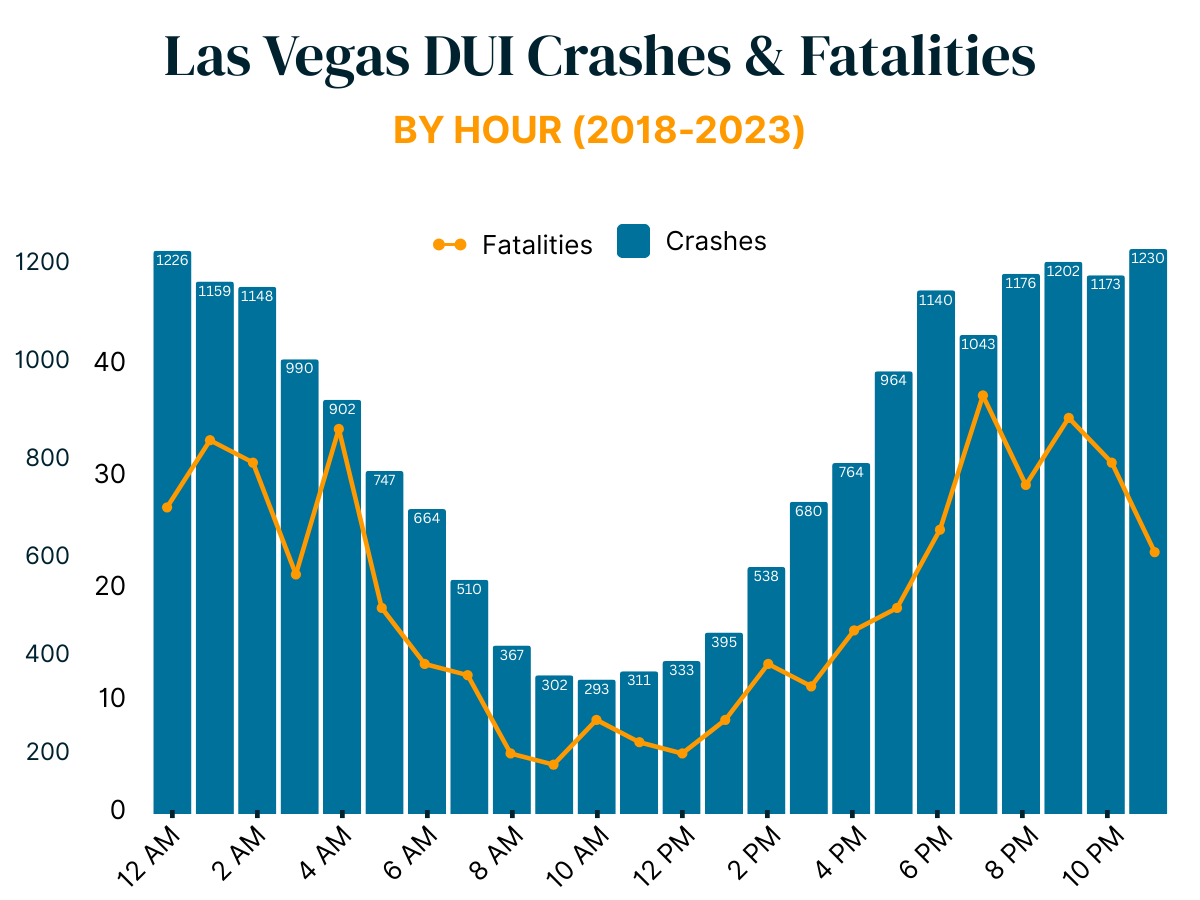 Top Risk Hours
- 11:00 PM – Midnight: Over 1,200 crashes each, making this the most dangerous time on the roads.
- 1:00 AM – 2:00 AM: Around 1,150 crashes in each hour, showing that risk stays high as bars close.
- Late Night/Early Morning Severity: 4:00 AM has fewer crashes (902) but one of the highest fatality counts (34), indicating those crashes are often more severe.
Injury Patterns
- Injuries track closely with crash peaks, topping 900 during 11:00 PM and 6:00 PM.
- Evening rush hour (6:00 PM) has high injury counts despite lower fatality numbers, possibly due to higher traffic volume.
Fatality Patterns
- 7:00 PM leads with 37 fatalities, followed by 9:00 PM (35) and 4:00 AM (34).
- Early morning crashes (2:00 AM – 4:00 AM) are disproportionately deadly, even with lower total crash counts.
Which Days & Holidays Are the Deadliest?
This section analyzes your provided data to identify which days of the week and specific holidays have historically been the deadliest for crashes, with a primary focus on fatalities.
Days of the Week: Where the Risk Peaks
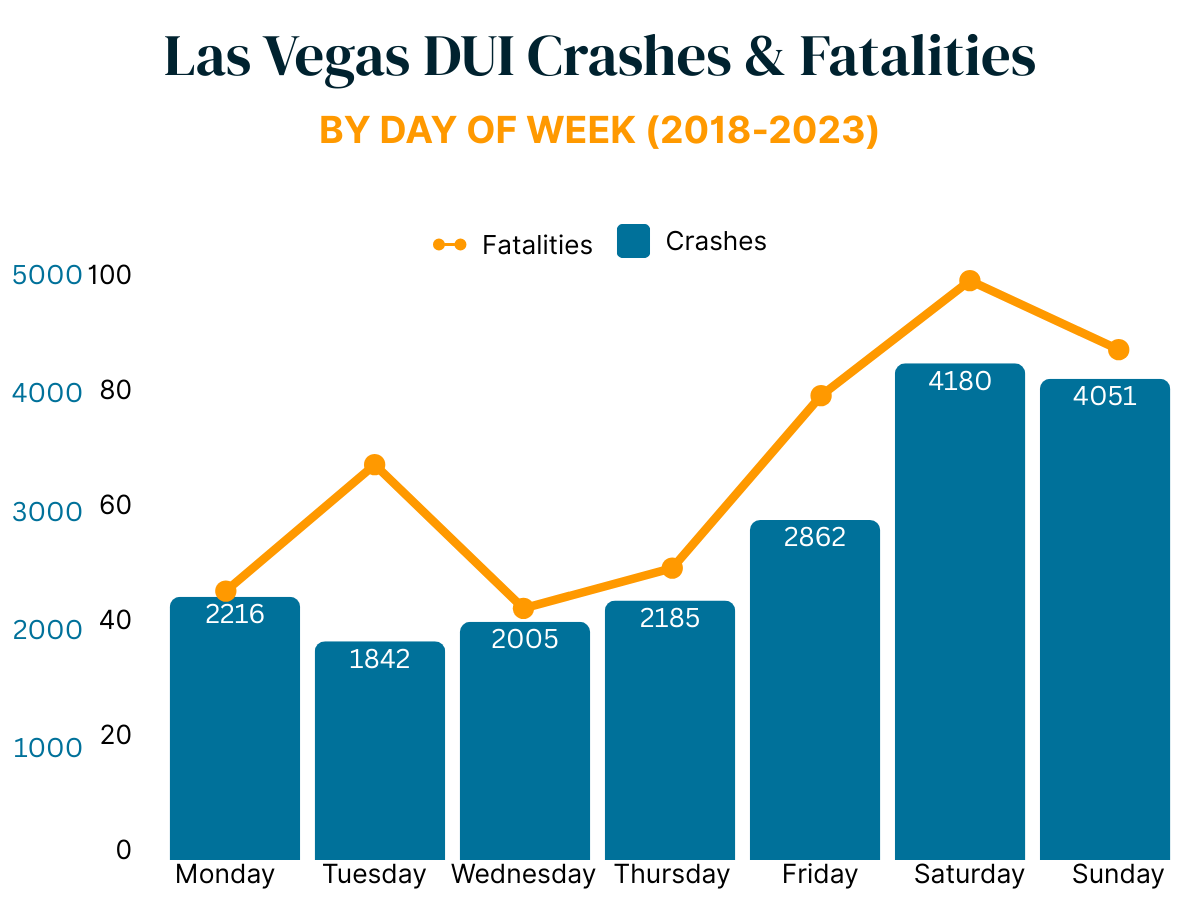
DUI-related fatalities in the Las Vegas area are heavily concentrated on weekends.
Top Fatality Days
- Saturday: 99 fatalities (4,180 crashes) – Highest crash and fatality totals of the week.
- Sunday: 87 fatalities (4,051 crashes) – Nearly as deadly as Saturday.
- Friday: 79 fatalities (2,862 crashes) – Start of weekend drinking and nightlife.
Lower-Risk Days
- Monday, Wednesday, and Thursday see fewer fatalities (42–49 range).
- Tuesday anomaly: 67 fatalities despite fewer crashes, indicating a higher fatality rate per crash.
Deadliest Holidays: High-Profile Danger Days
While most holidays in the dataset show relatively few fatalities, several stand out for crash and injury volume. 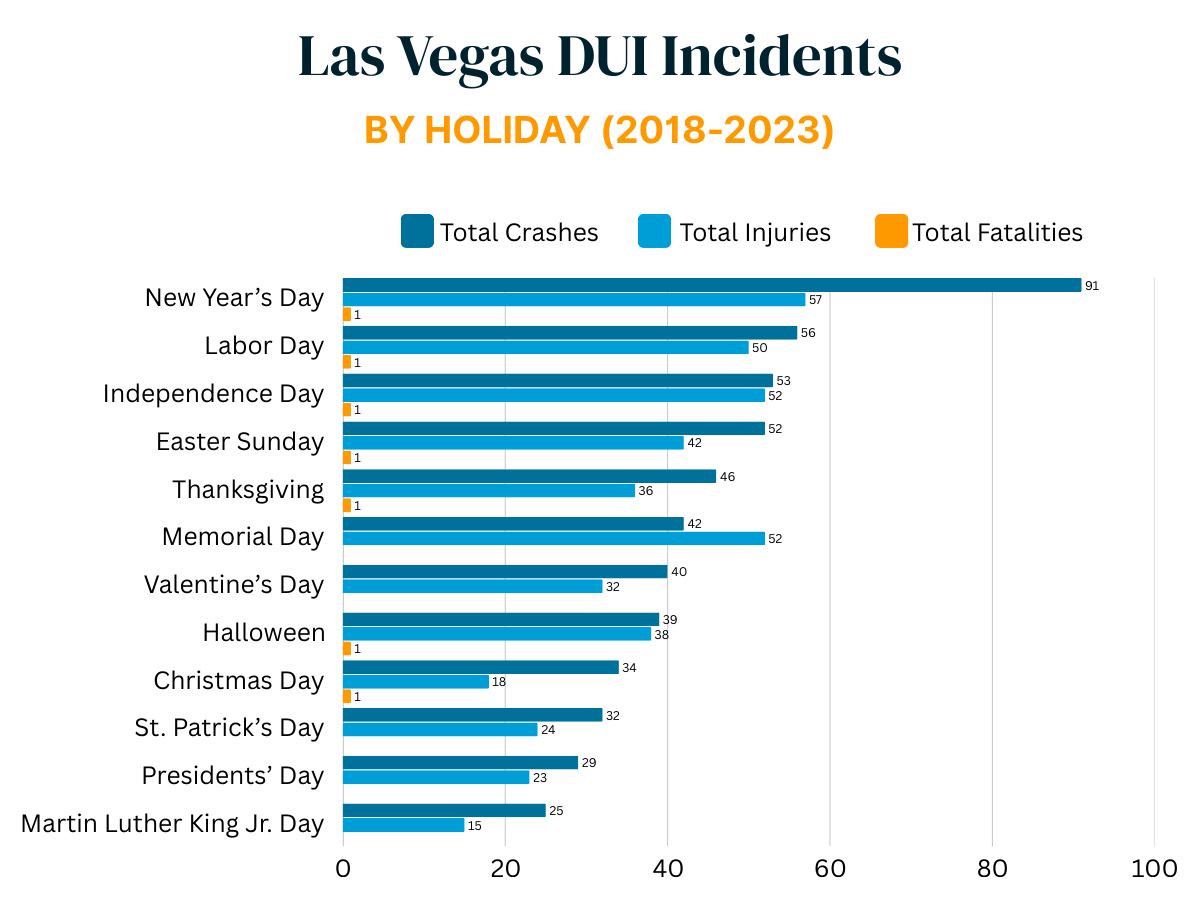 Holidays with Highest Fatalities (1 each)
- New Year’s Day – 91 crashes, 57 injuries
- Labor Day – 56 crashes, 50 injuries
- Independence Day – 53 crashes, 52 injuries
- Easter Sunday – 52 crashes, 42 injuries
- Thanksgiving – 46 crashes, 36 injuries
- Halloween – 39 crashes, 38 injuries
- Christmas Day – 34 crashes, 18 injuries
Highest Crash Volume
- New Year’s Day leads with the most crashes and injuries among fatal holidays.
Notable High-Injury Holidays (no fatalities)
- Memorial Day – 52 injuries
- Valentine’s Day – 32 injuries
- St. Patrick’s Day – 24 injuries
Even holidays with zero fatalities in this dataset still have substantial crash and injury numbers.
Who Are the DUI Drivers?
Understanding the demographics of individuals involved in DUI crashes is crucial for developing targeted prevention strategies. This section analyzes the age and sex distribution of DUI drivers based on your data. DUI Driver Age Distribution 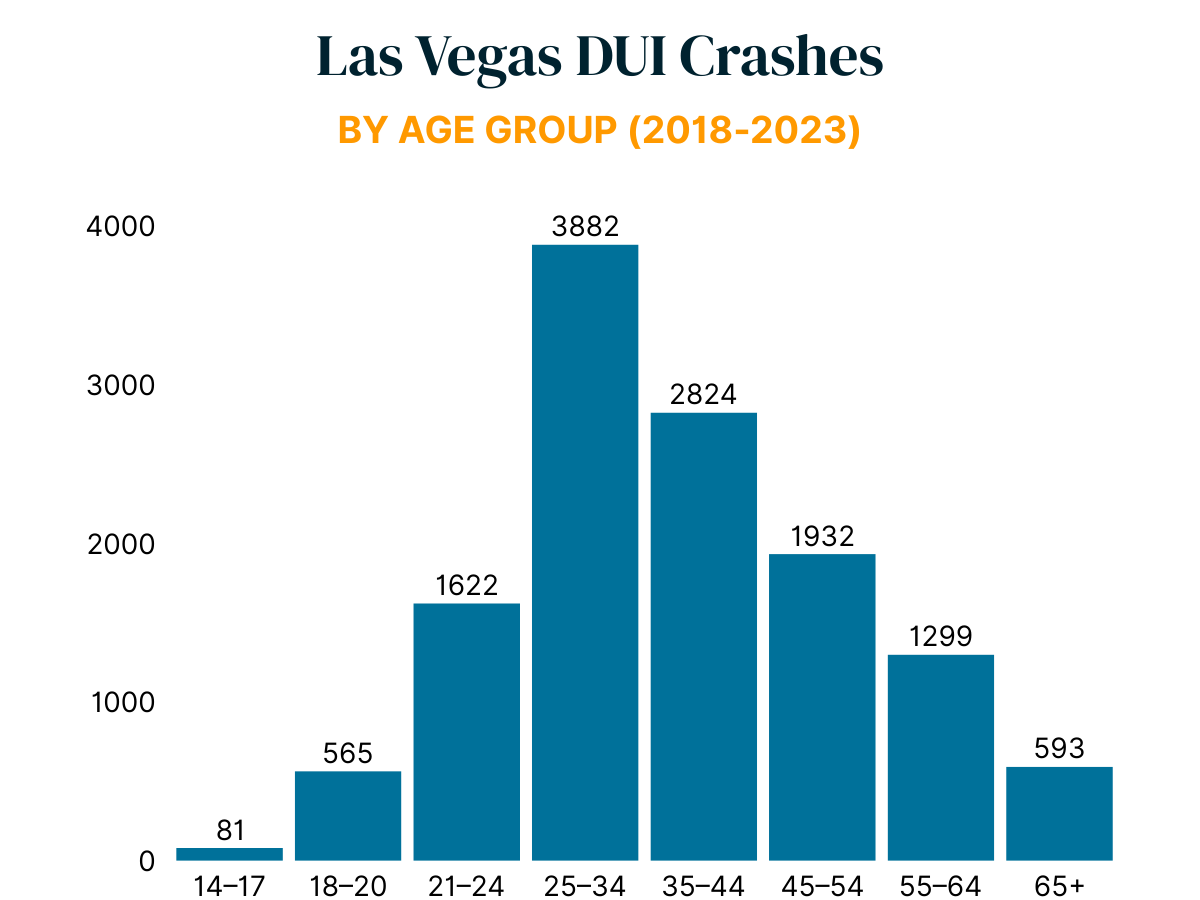 *Percentages exclude “Not Reported” cases (4,974).
Key Takeaways
- Prime Risk Group: Ages 25–34 are the single largest group, representing nearly 4 in 10 DUI drivers.
- Midlife Risk: Ages 35–54 make up almost half of cases, showing DUI isn’t just a “young driver” problem.
- Post-Legal Drinking Spike: Ages 21–24 remain a high-risk bracket (16.35%), showing risk doesn’t drop immediately after turning 21.
- Older Adults: Drivers 65+ still account for almost 6% of cases.
- Data Gap: Large “Not Reported” group could shift these percentages if accurately classified.
DUI Driver Sex Distribution
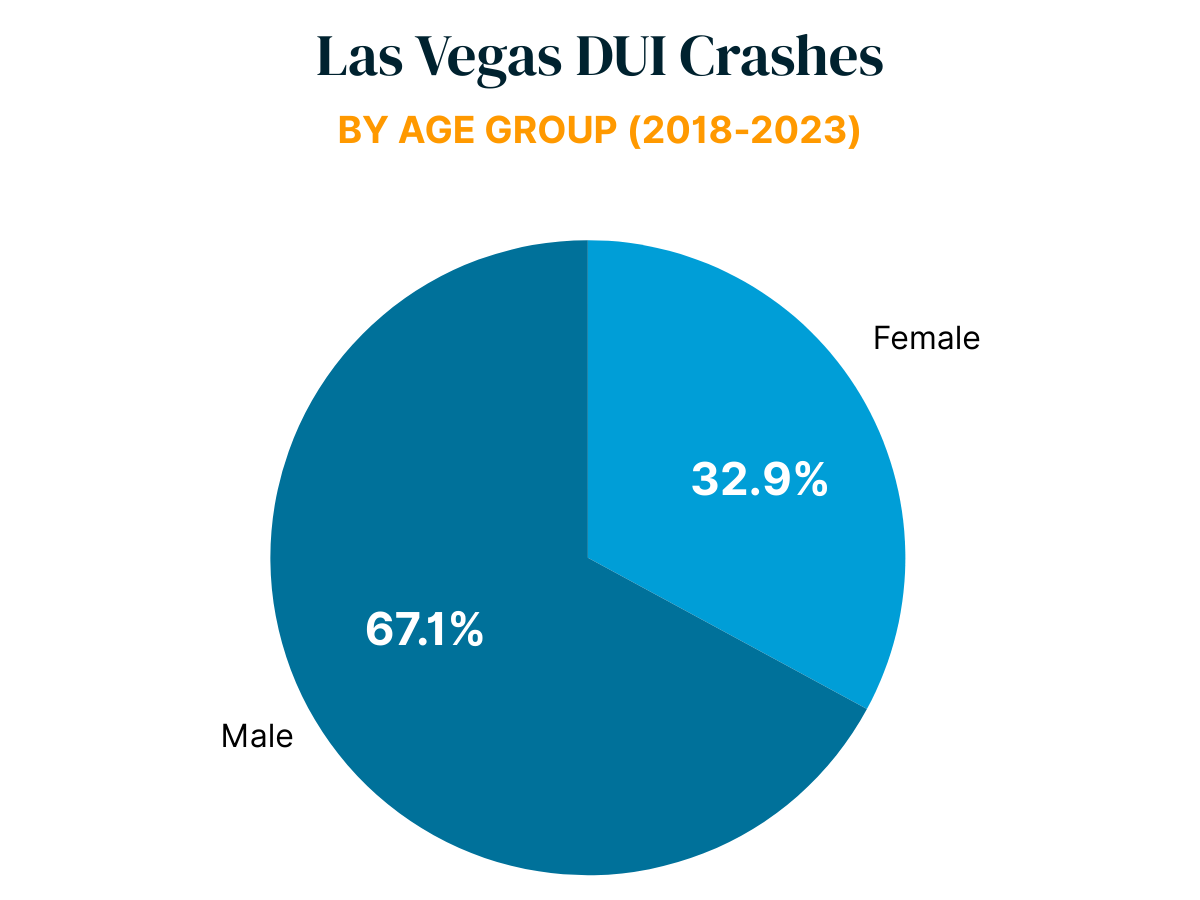 *Percentages exclude “Blank” and “Unknown” entries (4,755).
Key Takeaways
- Male Majority: Men make up two-thirds of reported DUI drivers.
- Female Share: Women account for about 1 in 3, showing DUI risk is not exclusive to men.
- Missing Data: High number of blank entries means true gender split may vary slightly.
Crash Severity in Las Vegas DUI Crashes
Analysis of 11,524 DUI-related crashes in Las Vegas shows that while most incidents don’t result in visible injuries, thousands still cause serious or fatal harm. 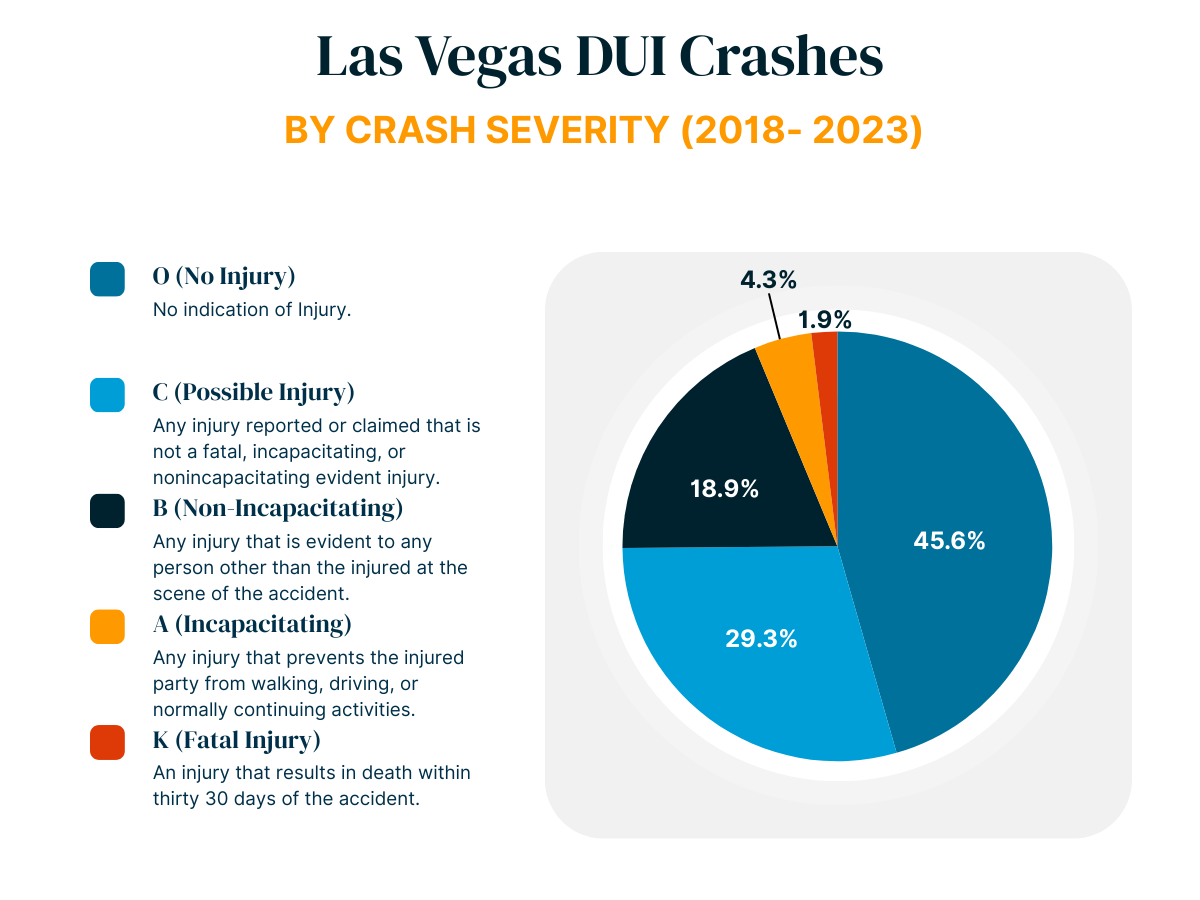 *Percentages exclude “Not Reported”, “Unknown”, and “Unclassified” entries (5.9%).
Key Takeaways
- Most Are Minor or No Injury: Nearly 3 in 4 crashes (O + C) caused no visible injury or only possible/minor injuries.
- Serious Harm Still Common:
- Fatal: 211 crashes (1.9%) ended in death.
- Severe (A-class): 470 crashes (4.3%) caused life-altering injuries.
- Visible but Non-Disabling (B-class): 2,047 crashes (18.9%).
- Overall Impact: 25.1% (K + A + B) of crashes caused serious injury or worse – over 2,700 incidents in total.
- Data Gaps: 5.9% of crashes had unknown or unreported severity, leaving the true harm level uncertain.
Why Las Vegas Is Different
Las Vegas’s DUI problem is shaped by unique environmental factors that don’t exist in most U.S. cities:
- 24/7 Alcohol Availability: No closing time for bars, casinos, or liquor sales means there’s no “last call” to naturally curb consumption.
- Tourism-Driven Nightlife: High volume of visitors unfamiliar with local roads, often engaging in binge drinking during short stays.
- Event Economy: Frequent concerts, sporting events, and conventions create spikes in impaired driving risk.
- Density of Alcohol Venues: Casinos, bars, and convenience stores selling alcohol are within walking (or driving) distance nearly everywhere in tourist-heavy areas.
This constant flow of activity leads to elevated crash rates in late-night and early-morning hours, when other cities see natural declines.
If You’ve Been Injured by a Drunk Driver in Las Vegas Contact Valiente Mott
If you or a loved one were hurt in a crash caused by a drunk driver, you don’t have to face the aftermath alone. At Valiente Mott Injury Attprneys, our Las Vegas personal injury attorney fights to hold negligent drivers accountable and helps victims recover compensation for medical bills, lost income, and pain and suffering.
Contact us online today or call (702) 919-6768 to schedule your free consultation.
Methodology
This analysis is based on official crash data provided by the Nevada Department of Transportation (NDOT). We requested the raw statewide crash data directly from NDOT covering the period April 2018 through November 2023. From this dataset, we filtered for crashes within the Las Vegas metropolitan area (Las Vegas, North Las Vegas, and Henderson) where alcohol was marked as a contributing factor.
The NDOT dataset includes three core tables:
- Crash Data: Records of all reported traffic crashes, including location, date, and severity.
- Person Data: Information about individuals involved in crashes, including age and sex.
- Vehicle Data: Vehicle-level information for each crash.
Using these tables, we compiled pivot tables and visual analyses to identify high-risk times, locations, and holidays for DUI-related crashes. Crashes were categorized by severity using federal and state definitions (e.g., fatal, incapacitating injury, non-incapacitating injury, possible injury, no injury).
Limitations & Disclaimers
- Data Source & Collection: Crash data is collected by law enforcement agencies at the scene and then reported to NDOT. NDOT maintains the crash database for the purpose of improving traffic and highway safety in accordance with 23 U.S.C. Sections 148 and 405.
- No Individual Reports: NDOT does not provide individual crash reports. For specific incident records, contact the responding law enforcement agency.
- Accuracy & Completeness: NDOT assumes no responsibility for the accuracy or completeness of the crash data. Errors, omissions, or changes may occur during the reporting and compilation process.
- Legal Protection of Data: All crash data listings, reports, and dashboards are protected under 23 U.S.C. Section 407, meaning they are not admissible as evidence in federal or state court proceedings for damage claims related to crash sites.
- Format: Data was provided in digital format and analyzed using pivot tables, charts, and mapping to identify DUI crash patterns.